Today energy resources are becoming increasingly scarce. Sadly renewable energy just make up for a small percentage of our energy source and could not keep up with the increasing demand in todays society.
As energy needs drive society to also plunder and abuse the natural beauty of our environment, my experiment will take place in a setting that highlights this issue.
As energy needs drive society to also plunder and abuse the natural beauty of our environment, my experiment will take place in a setting that highlights this issue.
ANALYTICS ENGINE : USING ELECTROSTATIC ACTIVITY
This environment is designed to emphasise the magnitutde of the topic of energy sources.
In physics, energy is measured by way of density, such abstract and intangible - that cannot easily be discerned in its raw form. So, as well as visual recognition, to make it interesting and to bring to focus the growing number of platforms of sensory technologies, my analytics engine also explores interpreting data so one can also discern information through a metaphysical experience.
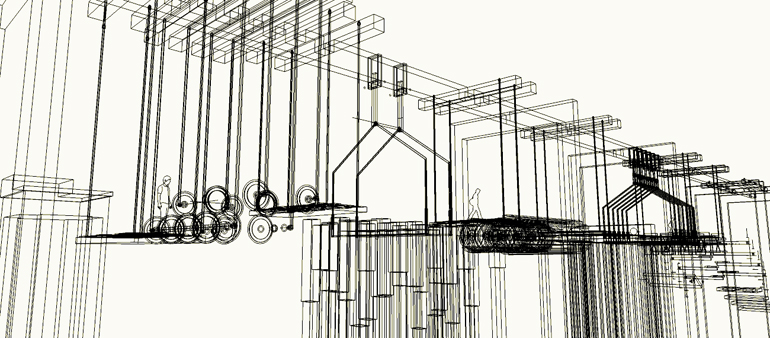
This analytics engine is an energy harvesting island where one can discern raw data in real-time environment by way of multi-sensory platforms.The local player represents humanity.
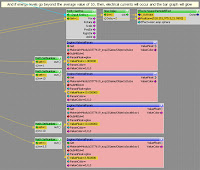
Entire Flowgraph
MULTI-SENSORY ANALYTICS ENGINE
MUSIC: CUT&RUN by KEVIN MACLEOD
TOOLS: SANDBOX 2, SKETCHUP, FRAPS, PREMIERPRO
IMAGES:
lwa.gov.au
centerforabetterlife.com
schnews.org.uk
australianclimatemadness.com
beyondzeroemissions.org
ecogeneration.com.au
uq.edu.au
sustainable.unimelb.edu.au
hardenup.org
LINKS:-
Crysis Level - http://www.mediafire.com/?d5htnuzoj47ul
Objects File - http://www.mediafire.com/?50glvboi6g50u
3 DEMONSTRATIONS OF FLOWGRAPH ANALYSIS
This footage illustrates how data collected registers on the bargraph which represents energy levels. Midway up the graph is a horizontal line which represents the average required energy level (in this case 10). Only when the average required is reached, the wires glow accordingly as well as the energy tubes to the left where energy is stored.

In this footage, energy levels affect humanity where when the maximum is reached, the player possesses superhuman abilities which also disspates as soon as the energy level is decreased. When the level is at a low point (in this case 7), the player can only walk.
This footage shows how when the maximum energy level is reached, a blast of energy field is created. (Note that the bargraph is not at its maximum but for illustration purposes, the highest number collected which is 12 will trigger the blast)
RESEARCH : ELECTROSTATIC ENVIRONMENT
Creating an electrostatic environment in Sandbox 2 Editor with particle effects, energy fields and flowgraphs-
For another course, I've been looking into electrical currents and how it is represented in a scene or a 3d environment and the type of programs used such as aftereffects where one can make these effects. In this cross-researching, I've discovered that there are very limited or no tutorials at all on how to be able to do this in crysis. I'm sure that the more experienced sandbox users can create their own electrically charged scene but the tutorial I've created is a step by step process that would help those who are less experienced to be able to create a dynamic looking environment and the ideas presented in this tutorial should generate other ideas for different uses and effects. These ideas are (maybe new) or maybe considered by some to be general knowledge but I just want to ensure they are widely shared out there.
What they will learn from this tutorial is how to make an energy field as well as learn its limitations and learn how to apply this in the scene. Also for experiment 1, I was finding that the available simple video tutorials for flowgraphs are also quite limited and also limited in what they teach, so in this tutorial they will also learn how to put together a simple flowgraph to make their particle effect reactive. Another idea they'll get from this tutorial is how to change the ground to a flooded effect, or create puddles without having to adjust or edit terrain to use the natural water levels and also without using watervoxels, this would suit shallow water or even contain it in a shallow container. It is also the simplest way to use for this purpose especially on higher grounds.
Fx_energyfield and its use is something I've discovered when exploring different material effects. There is no mention or instructions at all on how this can be used, so I wanted to throw it out there. I'm sure the use of it would generate other ideas for those looking to extend their stuff.
The wet ground is also something I've discovered after a frustrating unsuccessful lengthy process trying to use watervoxels to achieve what I wanted. I haven't seen this idea in any of the forums or tutorials so I also wanted to throw it out there.
Also, the available information using particle effects out there especially for spawing with flowgraphs is limited and most of the available tutorials for particle effects are mainly about fire, tornadoes and such. So again, I wanted to share it.
And ultimately, I wanted to create a simple tutorial using flowgraphs as there aren't many at all and I want to add to what’s available.
references: www.maxedgaming.com/tutorials; incrysis; www.incrysis.com/forums; doc.crydev.net
[note that this video could easily have been a 12-15 min tut but due to the 7min time limit, its been condensed to a point that would probably be more suitable to an intermediate user. The following notes below had been attached to the video to ensure that the user knows what knowledge is required as well as note some details that could be extended]
[HOW TO CREATE AN ELECTROSTATIC ENVIRONMENT USING FLOWGRAPH, FX_ENERGYFIELD AND SPAWN PARTICLE EFFECTS USING SANDBOX 2 EDITOR.
This tutorial assumes that you are familiar with the basics of CryEngine's Sandbox Editor v2 and have created your own basic level.
You'll also need to be able to export your own 3D objects from SketchUp.
To extend this tutorial, explore the 'TIPS' below.
To start, open up your own level.
[difficulty : beginners-intermediate]
TIPS:
1. when using fx_energyfield, make sure it is viewed against the normals of a 3D object;
2. disable collision of the 3D object to be transformed into the fx_energyfield as its solid properties will still be effective in game
3. as the fx_energyfield is still an object, it can function as an entity and can be transformed as usual. (move, scale, etc)
4. create simple 3D objects for less dense energyfields
5. the spawn particle effects (electrical currents) can be assigned to the position of the fx_energyfield and the trigger could be its variable parameter
6. for shallow contained water or ground puddles, change materiality instead of using watervoxels
TOOLS: SANDBOX 2 EDITOR, CAMTASIA, SKETCHUP
for more sandbox2 tutorials refer to www.maxedgaming.com/tutorials]
[(frozen feeds) the xml data in my exp have been manipulated for illustration purposes]
SWOT Analysis of Pachube Feed:
Initially, I had looked at two interesting topics from the arch1391 group for our initial SWOT analysis that we could also use to drive our analytics engine. I had spoken to Trent a 2nd yr student doing research on tracking and analysing the RGB components in objects which I initially thought would be something I would like to work with as colours are very strong visualisation tools. Another research I found interesting was by another student tracking flight paths.As his feed was also frozen, he proposed a number of possible data that can be derived from his study such as accelerometer data, angle changes, as well as axis position at any given time of the robot designed to track the flights. There's also the light sensitive facade system that I found interesting.
Strengths
The use of colour is a strong tool for representation. It can be applied to many situations and are easily discernible to most. Colour can also represent abstract concepts such as heat or cold, So, I may actually use this for my energy concept. Not sure.
Weaknesses
Althouth, colour is one of the most common tools for representation, it also fails many who are colour blind or who are visually challenged. Therefore, we find that most colour representations are also supported by other forms of medium.
Opportunities
As the RGB colours are precise values, these can easily be supported by specific instances or objects. For example, Red is triangle and Blue is square and so forth. If these matching symbols can be widely used and known then we can have a unique and universal, bi-sensory representation that can easily be applied for wider use.
Threats
Not sure about threats but, using colour representations would probably make up the majority of the experiments so I'd like to explore other avenues of representation. Colour and materiality are always mainly used for representation. I could possibly explore - speed, but which also is again more visual.
INFOGRAPHICS
(EFFECTIVE VISUAL TOOLS)
www.flapmarket.com
www.consumerenergyreport.com


